Climate Change Indicators: Sea Level
Key Points
After a period of approximately 2,000 years of little change (not shown here), global average sea level rose throughout the 20th century, and the rate of change has accelerated in recent years. When averaged over all of the world’s oceans, absolute sea level has risen at an average rate of 0.06 inches per year from 1880 to 2013 (see Figure 1). Since 1993, however, average sea level has risen at a rate of 0.12 to 0.14 inches per year—roughly twice as fast as the long-term trend.
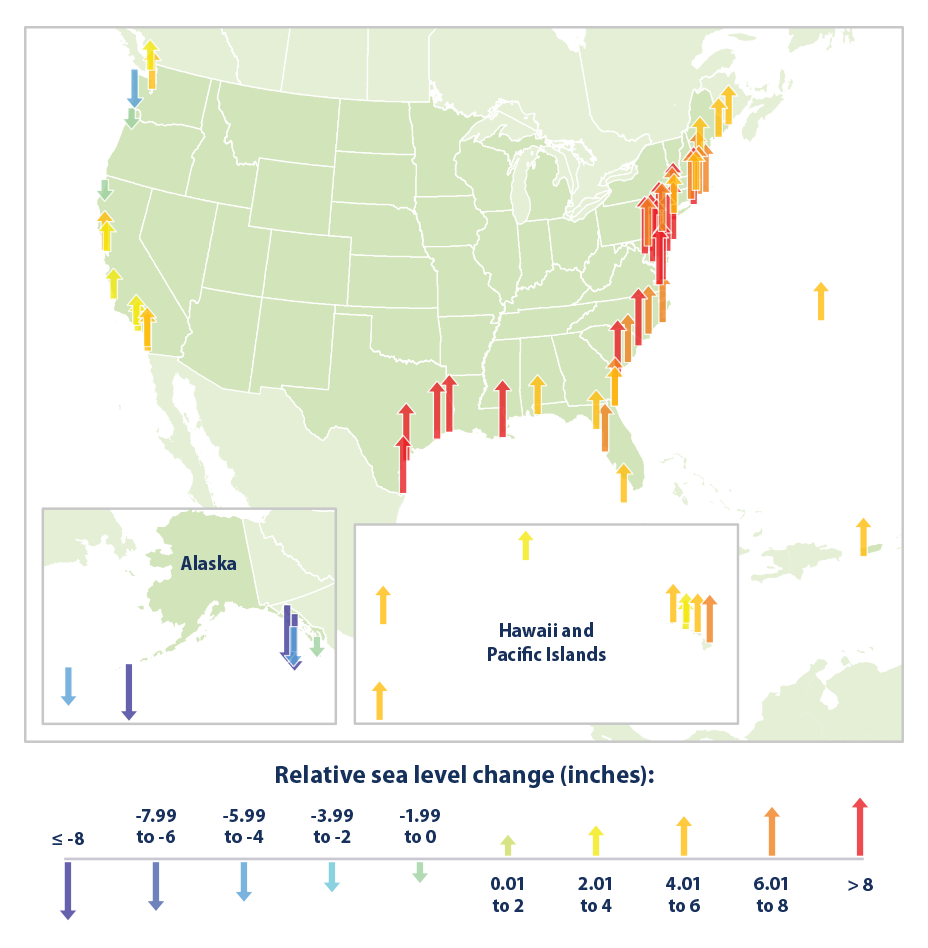
Relative sea level rose along much of the U.S. coastline between 1960 and 2020, particularly the Mid-Atlantic coast and parts of the Gulf coast, where some stations registered increases of more than 8 inches (see Figure 2). Meanwhile, relative sea level fell at some locations in Alaska and the Pacific Northwest. At those sites, even though absolute sea level has risen, land elevation has risen more rapidly.
While absolute sea level has increased steadily overall, particularly in recent decades, regional trends vary, and absolute sea level has decreased in some places.2 Relative sea level also has not risen uniformly because of regional and local changes in land movement and long-term changes in coastal circulation patterns.
This science needs to be looks at very closely, more lock downs and tyranny coming.
In some places the land in rising or falling while the ocean stays constant?
Where is the land not rising or falling and how do they really know the ocean height?
The earth is spinning, centripetal forces acting at the equator are different than at the poles. This will affect water how?